 SUPPORT



 3EX United States
Blog
Fast databases aren’t built by hardware alone. Optimizing database performance in colocation means finding and addressing the factors that slow queries or waste resources, from ineffective indexes to inefficient use of CPU, memory, and storage. The goal is to improve response times and throughput while keeping resource use aligned with the workload.
Optimizing database performance in colocation takes more than adding indexes or increasing capacity. Use performance metrics to find the bottleneck before changing the database, then measure whether the change helped. This guide explains how indexing and query execution affect performance, which metrics reveal pressure on system resources, and how database configuration and the colocation environment work together.
Key Takeaways
- Match indexes to common filters and query patterns, and avoid adding indexes that create unnecessary maintenance work.
- Use execution plans to pinpoint inefficient queries before changing SQL or database configuration.
- Track CPU, memory, disk I/O, query time, and read/write latency against a baseline to spot emerging bottlenecks.
- Assess response time and throughput alongside resource use to identify whether tuning, scaling, or a different infrastructure fit is needed.
1. Indexing strategies
A database index helps queries find rows without inspecting every record. For example, an index on the users table’s email column can speed up requests that filter by email, particularly when the filter matches relatively few rows.
Choose an index type that matches the data and query pattern. B-tree indexes work well for many ordered lookups, while Hash and Bitmap indexes suit other data characteristics. A composite index can support queries that filter on multiple columns, but column order matters. Indexes can speed up reads, yet each one adds work to inserts, updates, and deletes. Balance read performance against write activity and concurrency.
Use query execution plans to spot full scans and inefficient access paths. If a query reads every row, review its filters and the columns it returns, then add or adjust an index to serve that query. Avoid indexing every column. Caching frequently requested results and tuning queries can reduce repeated database work, while replication can distribute read requests across database copies. Each approach addresses a different bottleneck.
Index maintenance matters too. Review index statistics and usage, then reorganize or rebuild indexes when fragmentation or performance indicates a need. Reorganization optimizes an existing index; rebuilding drops and recreates it. Because indexes add disk I/O and storage demand, measure their effects on both reads and writes after each change.
When comparing colocation options for database hosting, assess network connectivity, cross-connects, power capacity, and support for hardware operations. Security planning should cover access controls, encryption in transit and at rest, backups, recovery procedures, and applicable compliance obligations. The National Institute of Standards and Technology (NIST) notes that data-mining operations can expose sensitive information. To migrate with minimal downtime, back up the database, prepare the target environment, copy data, replicate ongoing changes, schedule the cutover, and validate application access before retiring the source.
For example, full cabinet colocation provides dedicated physical space for database server hardware.
2. What is database optimization?
Database optimization reduces query delays and wasted resources while preserving the workload’s expected results. Start with evidence, not guesswork. An execution plan shows how a database retrieves rows, applies filters, and combines tables. Reviewing it can reveal full scans, costly sorts, or joins that process more data than necessary.
Next, refine the SQL. Select only required columns instead of using SELECT *, and examine whether filters narrow results early. An application that makes an N+1 query issues a separate request for each related record. A join or batch fetch can reduce those database roundtrips when it fits the data relationship. Query tuning means changing SQL or its access path, then comparing execution plans and latency before and after.
Workload analysis helps distinguish a slow query from a broader capacity issue. Group queries by frequency, execution time, and resource demand, then compare read-heavy and write-heavy periods. A slow query log identifies statements with long execution times; profiling can show where they spend time. MySQL Performance Schema tracks metrics such as query execution times and CPU usage, helping connect SQL behavior to server pressure.
Execution plans depend on accurate information. Database statistics describe data distribution and help the optimizer estimate how many rows each operation will process. Refreshing stale statistics may improve a poor plan; verify the new plan with representative requests. If execution remains slow, check whether storage I/O, memory pressure, or connection handling is the limiting factor. Caching can reduce repeated work, but stale results or poor invalidation rules can undermine correctness.
In colocated infrastructure, database optimization spans SQL, server resources, and storage behavior. Start with the slowest costly queries, make one focused change, and measure its effect under the same workload. For workloads that also need dedicated compute, review infrastructure options alongside database requirements.
3. How can I track database performance effectively?
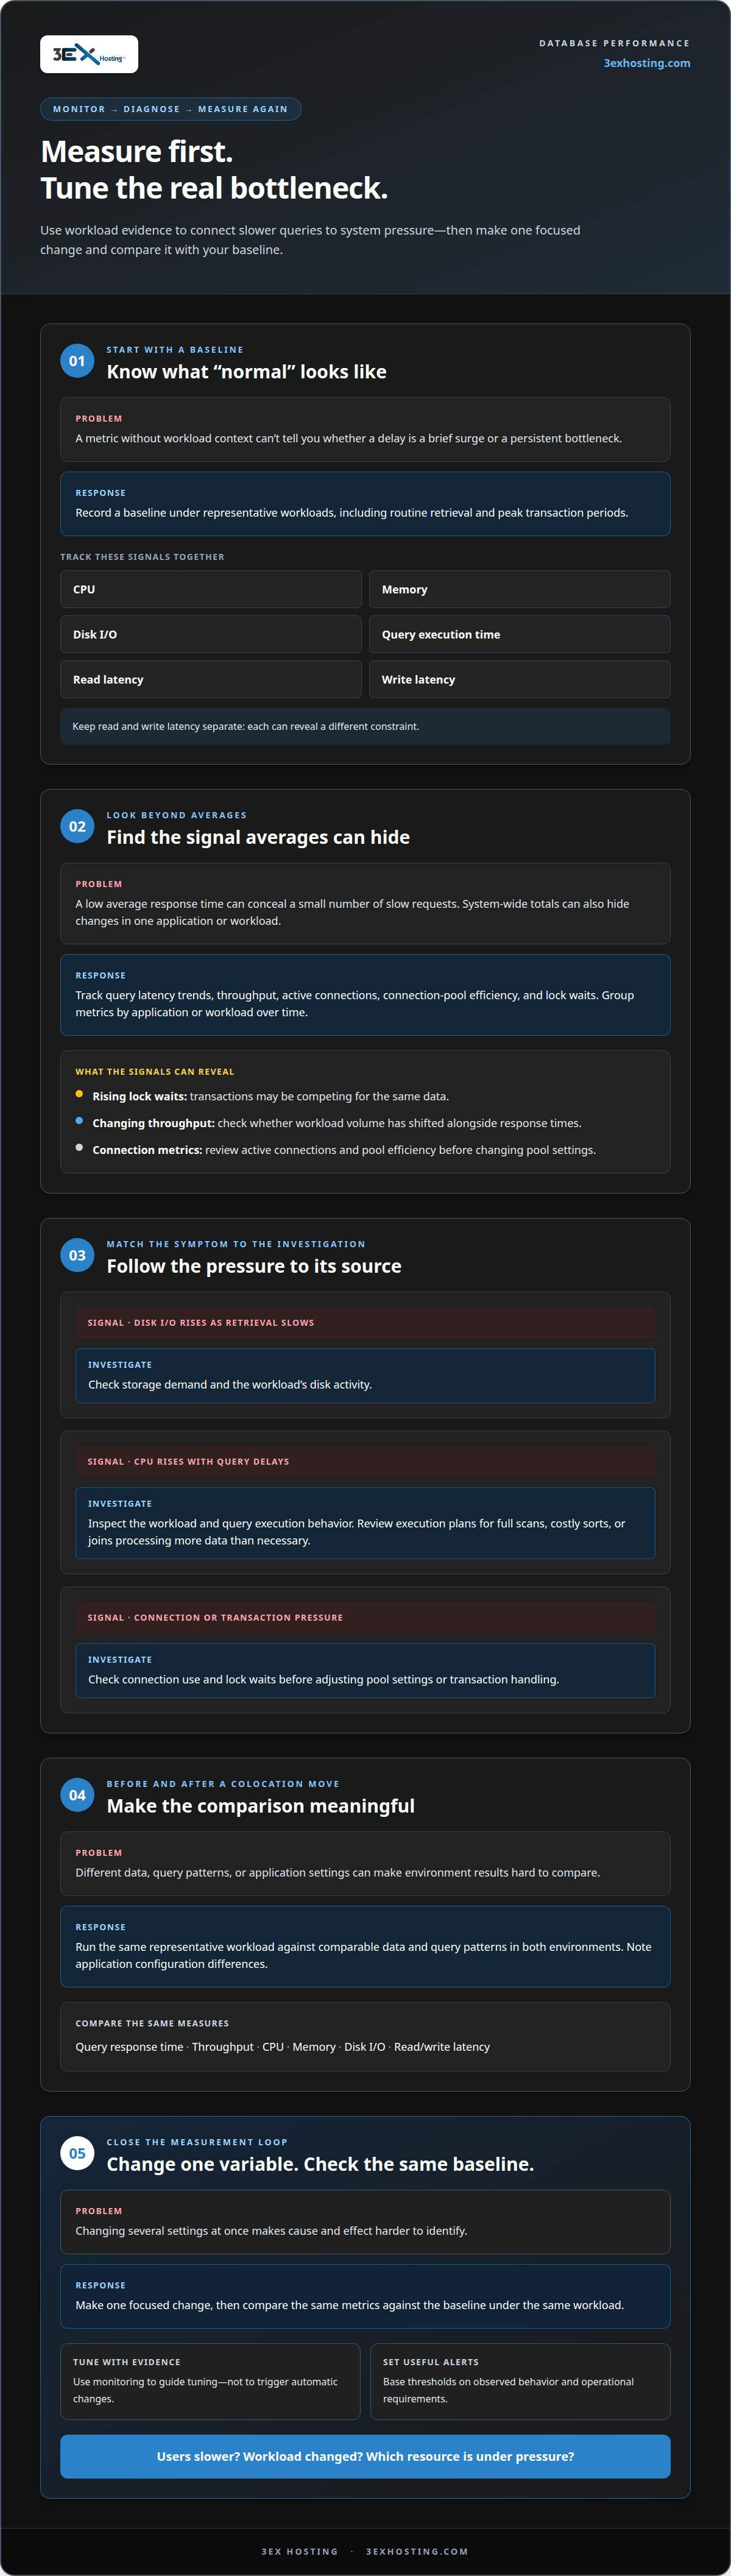
Monitor application behavior alongside database and hardware metrics. First, record a baseline under representative workloads, including routine retrieval and peak transaction periods. Track CPU, memory, and disk I/O alongside query execution time to identify whether delays stem from processing, memory pressure, or storage activity. Record read and write latency separately, since each may reveal a different constraint.
Measure more than average response time. Track query latency trends, throughput, active connections, connection-pool efficiency, and lock waits. A low average can conceal a few slow requests, while rising lock waits may indicate transactions competing for the same data. Group metrics by application or workload over time so a change in one service does not disappear inside the system-wide average.
To benchmark before and after a colocation move, run the same representative workload against comparable data and query patterns in both environments. Compare query response time, throughput, CPU, memory, disk I/O, and read/write latency. Note any application configuration differences that could affect the results.
Use monitoring to guide tuning, not to trigger automatic changes. When disk I/O rises alongside slower retrieval, investigate storage demand. When CPU rises with query delays, inspect the workload and execution behavior. Check connection use and lock waits before adjusting pool settings or transaction handling. Change one variable at a time, then compare the same metrics with the baseline to make cause and effect easier to identify.
Keep dashboards focused on decisions: are users seeing slower responses, has workload volume shifted, and which resource is under pressure? Set alert thresholds based on observed baseline behavior and operational requirements. Review trends after deployments, schema changes, and infrastructure adjustments. Consistent measurement helps distinguish a brief workload surge from a persistent efficiency problem.
4. Response time, throughput, scalability, and resource utilization
Response time measures how long an operation takes; throughput measures how many requests the database handles over time. Track both during normal traffic and busy periods. A system may return individual results quickly but still struggle as concurrent requests increase. Comparing latency and throughput helps distinguish a slow query from a capacity bottleneck.
In colocation, monitor query latency, read/write latency, throughput, CPU load, memory use, disk I/O, storage utilization, connection-pool efficiency, and replication lag. These metrics show whether response delays coincide with resource pressure. Also record workload shifts and backup health, since traffic changes or backup activity can affect available capacity.
Network latency adds time to exchanges between applications and database servers, especially when an operation requires repeated roundtrips. Bandwidth affects the speed of large data transfers, backups, and replication. Track network behavior alongside database response times to avoid mistaking network delays for slow query execution. Cross-connects provide direct connections between networks in a data center.
CPU, memory, and storage can each become constrained when workloads compete for resources. High CPU load can limit query processing, memory pressure can reduce space available for caching, and heavy storage activity can raise disk I/O latency and slow reads or writes. Use resource metrics to locate the bottleneck before changing server capacity or database settings. Query optimization can reduce unnecessary work, while connection-pool adjustments can help manage demand. Change one factor at a time and compare results under similar traffic.
To scale, match the approach to the constraint. Vertical scaling adds capacity to a server; horizontal partitioning or read replicas can distribute suitable workloads across systems. Caching frequently accessed data can also reduce repeated database requests. For network connectivity needs, explore cross-connect options as part of the infrastructure plan.
3EX Hosting
3EX Hosting helps businesses align database infrastructure with workload, hardware, and growth requirements. For teams running their own database servers, Full Cabinet Colocation, Private Colocation Suites, and Cage Solutions provide options for locating equipment in a data center. Managed Cloud Hosting is another fit when a cloud-based environment better matches the application’s needs.
Consider these options when resource demands, control requirements, or scaling plans call for a different infrastructure approach. The right fit depends on where the database runs, how its applications use it, and what level of control the team needs. Share those requirements to discuss a suitable direction.
Contact 3EX Hosting to discuss your database infrastructure needs.
Plan the Next Performance Improvement
Turn performance findings into a practical infrastructure decision. Define the workload your database must support, identify the constraints that matter most, and set priorities for control, capacity, and growth. This gives each infrastructure choice a clear purpose. A focused plan for optimizing database performance in colocation connects technical needs with the environment supporting your systems.
Keep the process iterative. As applications and traffic change, reassess whether the infrastructure still fits. Optimizing database performance in colocation means aligning software behavior, resource use, and infrastructure decisions over time. Let operational priorities guide the next adjustment instead of changing capacity without a clear target.
If you’re evaluating infrastructure for your database, discuss your setup with 3EX Hosting. Bring your workload needs and priorities to the conversation. A clear approach to optimizing database performance in colocation can help shape a practical next step.
Frequently Asked Questions
What is database optimization?
Database optimization is tuning data structures, SQL, and system resources so a workload runs efficiently while preserving correct results. For a practical starting point, choose a high-impact task, such as a checkout lookup, and record its response time and execution plan. Test a focused change against the same data and workload, then confirm it hasn’t impaired write operations or concurrent requests.
How can I track database performance effectively?
Combine database metrics with application-level observations to trace slow responses to their source. For example, correlate a delayed page request with database query timing, connection use, and storage activity. Focus dashboards on actionable trends and set alerts for meaningful deviations from normal behavior. Review trends after application releases or workload changes.
How do I adjust database server settings for better performance?
Adjust server settings to match the database engine, workload, and available hardware. Review memory allocation and connection-pool size, then change one setting at a time and measure the result. If a larger pool increases contention or memory pressure, revert it. Consider transaction duration and concurrent connections too: longer transactions can hold locks and restrict other work.
What is query optimization, and why is it important?
Query optimization reduces unnecessary work in a database statement, which can improve response times and conserve resources. For example, an application page that runs one query for each related item may create an N+1 pattern. A suitable join or batch fetch can reduce repeated database roundtrips. Review query behavior alongside application needs, and confirm changes still return the correct results.
How should database servers be configured for CPU, memory, storage, and RAID performance?
Configure server resources around measured workload demands rather than choosing settings in isolation. CPU capacity must support concurrent query processing, and memory must serve database operations and caching without creating pressure elsewhere. Assess storage latency and I/O under representative activity. RAID choices involve trade-offs among performance, usable capacity, and redundancy, so evaluate the design against workload and recovery requirements.
Which storage types and IOPS levels are best for database workloads in colocation?
No single storage type or IOPS target suits every database. Solid-state drives may improve storage performance, but the right configuration depends on read/write mix, data size, and latency sensitivity. Measure I/O under representative peak workloads, including backups, and compare demand with storage performance. Use those results to define capacity needs rather than relying on a generic IOPS figure.