 SUPPORT



 3EX United States
Blog
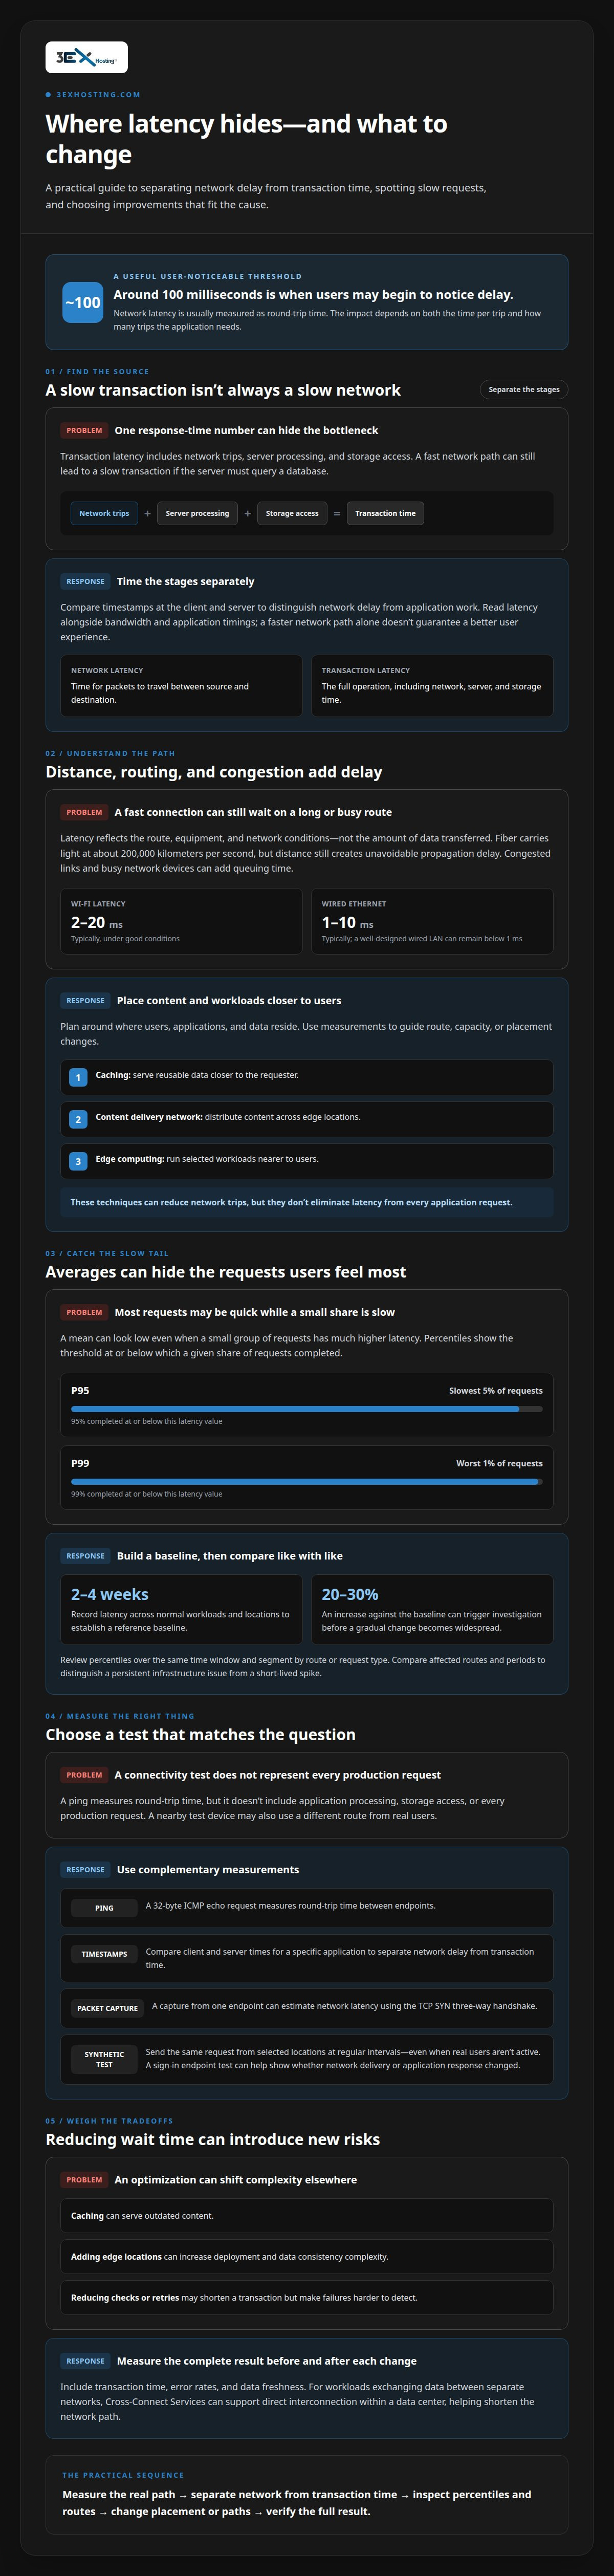
A fast connection can still feel slow when each request waits on the network. Network latency is the time data takes to travel between endpoints and back; the network latency impact on application performance depends on how many round trips an application needs and how long each one takes. Around 100 milliseconds is a useful rule of thumb for when users may begin to notice delay.
Latency is only one part of response time. Server processing, database work, and application design also contribute, so separating network delay from transaction latency helps pinpoint what is slowing a service.
This guide explains what network latency measures, how it differs from transaction latency, and how percentiles reveal slow requests that averages can hide. You’ll see how delay affects interactive applications, from web experiences to real-time communication, and why distance, network paths, and congestion matter. The result is a clearer way to interpret performance data and identify which improvements are most likely to help.
Key Takeaways
- Separate network delay from server and application processing to locate where a slow transaction spends its time.
- Use latency percentiles alongside averages to see whether a small share of requests is creating a poor experience.
- Relate performance measurements to application needs: interactive services are more sensitive to delay than tasks that can wait.
- Consider how infrastructure location and network design affect the path between applications and their users.
What is Network Latency?
Network latency is the time data takes to travel between a device and a server, usually measured as round-trip time in milliseconds. It reflects the route, equipment, and network conditions, not the amount of data transferred. Fiber carries light at about 200,000 kilometers per second, but distance and routing still create unavoidable delay.
Plan infrastructure around where users, applications, and data reside. A long route adds propagation delay, while congested links and busy network devices can add queuing time. Establish a baseline over 2-4 weeks, recording latency across normal workloads and locations. That baseline gives monitoring teams a reference for detecting changes rather than treating one measurement as the whole picture.
Major cloud providers and network services set terms by service and region. An SLA may define availability without promising universal end-to-end latency, which also depends on users’ routes and application architecture.
Reducing the distance between users and content can help: caching serves reusable data closer to the requester, a content delivery network distributes content across edge locations, and edge computing runs selected workloads nearer to users. These techniques can reduce network trips, but they don’t eliminate latency from every application request.
Use continuous monitoring to track latency alongside packet loss and availability. Set alerts against the baseline; an increase of 20-30% can trigger investigation before a gradual change becomes a widespread performance issue. Compare affected routes and time periods to distinguish a persistent infrastructure problem from a short-lived spike.
Synthetic monitoring adds a controlled test. A probe can send the same request from selected locations at regular intervals, even when real users aren’t active. For example, testing a sign-in endpoint can show whether network delivery or the application response has changed.
Review monitoring results by location and route, then adjust network paths, capacity, or application placement where measurements indicate delay. This makes low-latency infrastructure planning an ongoing process rather than a one-time design decision.
Network latency versus transaction latency
Network latency measures how long packets take to travel between a source and destination. Transaction latency covers the full operation, including network trips, server processing, and storage access.
A request can therefore have a fast network path but still take longer because the server must query a database. Conversely, congestion can delay packets before application processing begins. Compare timestamps at the client and server to separate these stages. Under good conditions, Wi-Fi latency is typically 2-20 milliseconds; wired Ethernet is typically 1-10 milliseconds. A well-designed wired LAN can remain below one millisecond.
HTTP/2 multiplexes requests over one connection, while HTTP/3 uses QUIC over UDP; connection reuse avoids repeating setup for each request. These approaches can reduce waiting, but they don’t remove server processing or a slow network path.
TCP and UDP under latency
TCP prioritizes reliable, ordered delivery, while UDP sends packets without TCP’s built-in delivery and ordering guarantees. This difference matters when round trips are long: TCP slow start doubles its transmission window each round trip, so a longer RTT can delay full throughput. For example, a TCP exchange takes 20 milliseconds at a 10-millisecond RTT, but 200 milliseconds at a 100-millisecond RTT. UDP avoids TCP’s acknowledgments, but applications using it must handle any reliability they require.
Optimization tradeoffs and risks
Latency optimization reduces waiting by changing request patterns, routes, or data placement. Each change has tradeoffs: caching can serve outdated content, while adding edge locations can increase deployment and data consistency complexity. Reducing checks or retries may shorten a transaction but make failures harder to detect. Measure the complete transaction before and after each change, including error rates and data freshness.
For workloads that exchange data between separate networks, Cross-Connect Services can support direct interconnection within a data center, helping shorten the network path.
Latency measurement and percentile statistics
Latency measurements turn network behavior into comparable response-time data. Read them alongside bandwidth and application timings, because a faster network path alone doesn’t guarantee a better user experience.
Latency measurement methods
A ping test measures round-trip time using a 32-byte ICMP echo request. It helps assess connectivity between endpoints, but it doesn’t include application processing, storage access, or every production request. For a specific application, compare client and server timestamps to separate network delay from transaction time. A packet capture from one endpoint can also estimate network latency using the TCP SYN three-way handshake.
Measure performance over the application’s real network path, not just from a nearby test device. An enterprise service may route users through different networks, and hardware or congestion can affect results. Keep test conditions consistent, then compare like with like to determine whether a change comes from the network or application.
Percentile statistics
A percentile shows the latency value at or below which a given share of requests completed. The 95th percentile represents the slowest 5 percent of requests, while the 99th percentile represents the worst 1 percent. These figures expose slow experiences that a mean can hide when most requests finish quickly.
For example, a low average can coexist with a much higher 99th-percentile result. Review both percentiles over the same time window, and segment them by route or request type. That makes it easier to see whether one endpoint, user group, or network path drives the delay.
Benchmarks across application types
Benchmarks depend on the task. Web browsing requests generally tolerate 100-300 milliseconds before users perceive sluggishness, while competitive online gaming targets latency under 50 milliseconds. Real-time interactive applications should keep total latency under 100 milliseconds for an acceptable experience.
Mobile performance varies with the wireless connection, device, and route to the server; assess it using actual application requests rather than assuming a universal target. A real-time chatbot has a different measure: its total response should be under 200 milliseconds, including network latency and model inference. Compare the relevant percentile with the application’s task, not a single benchmark shared across every workload.
Network latency and application performance
Network latency affects how quickly an application completes steps that depend on network communication. The network latency impact on application performance depends on physical distance, traffic, and how many services a request must reach.
Latency in APIs and database queries
API and database latency is the time requests spend traveling to services and returning with results. It matters because a computer may have to wait for each response before continuing. A database query can add network delay as well as storage and processing time. If an API request requires several sequential queries, each network round trip extends the total transaction.
Distance sets a physical limit: traveling 100 km through optical fiber adds half a millisecond of one-way latency and 1 ms to the RTT. Network equipment adds processing time too; a path through 15 routers might add 3-5 milliseconds. To assess the network latency impact on application performance, trace the request path and identify calls that run sequentially. Reducing unnecessary round trips can shorten waits without changing database hardware.
Latency in microservices
In a microservices architecture, one user action may trigger requests across several independently deployed services. Each network hop adds delay, so the complete response can take longer than the time reported by any single service. This matters most when services must respond in sequence, because later work can’t begin until earlier results arrive.
For example, an order request might call inventory, payment, and shipping services. If each call waits for another response, the total time reflects combined network and processing delays. Parallel calls can reduce waiting when tasks are independent, but congestion or a slow dependency can still delay the final response. Map the critical path, then examine the timings for each service and connection.
Use transaction traces to distinguish network waits from application work. Stable service time alongside rising network delay points to a route or traffic issue; rising service time points to processing or storage. Compare the slowest requests with typical ones, then address the critical-path bottleneck. This gives teams a practical way to understand the network latency impact on application performance without tuning every service at once.
3EX Hosting
3EX Hosting helps businesses place critical workloads in infrastructure suited to their performance and deployment needs. When latency analysis points to the location or connectivity of hosted systems, colocation can provide a practical path to reassess where servers sit and how they connect. Options include Full Cabinet Colocation, Private Colocation Suites, and Cage Solutions datacenter, alongside Managed Cloud Hosting.
The right choice depends on whether your team needs physical space for its own hardware or a managed cloud environment. Use measurements from your application’s users, services, and network paths to guide that decision. Infrastructure placement can support shorter routes, but application design and network conditions also shape end-to-end latency.
For a discussion of infrastructure options for your workloads, contact 3EX Hosting.
Turn performance findings into infrastructure decisions
Use latency data to inform the next architecture review, not as an isolated score. Map slow user journeys to their dependencies, then decide whether the bottleneck calls for application changes, a different deployment location, or revised connectivity. This makes the network latency impact on application performance actionable: teams can prioritize changes around critical services and the paths they rely on.
Before changing infrastructure, define the user experience the application needs to support and identify which workloads depend on nearby systems or consistent data access. Record current performance, make one change at a time, and compare the same transactions afterward. This approach helps teams distinguish a genuine improvement from a change that simply shifts the delay elsewhere.
For workloads that need dedicated physical infrastructure, 3EX Hosting offers Full Cabinet Colocation, Private Colocation Suites, and Cage Solutions datacenter. These options support different approaches to housing server environments as organizations plan connectivity and deployment needs.
Bring your infrastructure goals and performance priorities into a focused conversation. Contact 3EX Hosting to discuss a suitable next step and move forward with a clearer plan.
Frequently Asked Questions
How does network latency affect application response time and user experience?
Latency makes users wait longer for actions that depend on remote responses. Delayed search suggestions can make typing feel unresponsive, while lag in a video call disrupts turn-taking. The effect depends on whether the application can keep working while it waits. Interfaces that show progress or update locally can feel more responsive, even when a backend operation still takes time.
How much does each network round trip add to application load time?
Each sequential round trip adds approximately the measured round-trip time to the part of a load that has to wait for it. There’s no single fixed amount across networks. A DNS lookup usually requires at least one additional round trip before a TCP session can open. If a page makes dependent requests in sequence, those waits add up; independent requests may overlap instead.
How do latency, bandwidth, jitter, and packet loss differ in their impact on performance?
Latency is the delay before data reaches its destination and a response returns. Bandwidth describes how much data a connection can carry over time, so it matters most for large transfers. Jitter is variation in packet timing, which can disrupt smooth audio or video. Packet loss means data doesn’t arrive; recovery can add delays, while real-time traffic may sound or appear interrupted.
What is the impact of network latency on cloud application performance and cost?
Latency can slow cloud applications when users, application services, and databases communicate over distant or busy network paths. A service that waits on repeated remote calls may hold computing resources longer, while retries can add traffic and workload. These effects can influence resource planning and operating costs, but the financial impact depends on application design, usage patterns, and the cloud services involved.
How can developers measure application latency and identify network bottlenecks?
Developers can combine application tracing with network measurements to see where time is spent. Record timestamps at the client, API, and database, then compare a slow request with a typical one. Correlate the trace with route-level latency and packet-loss data. If client-to-server timing rises while service processing stays steady, investigate the network path; if processing rises, examine the relevant service or dependency.